Local Actions | San Rafael’s Emissions at a Glance | State and Regional Goals | Background
State Pillars & DRAWDOWN: Marin
San Rafael doesn’t exist in a vacuum. While we are leveraging or trying to combat regional, state-wide, national and even international actions and trends, we also have the ability and responsibility to collaborate with other efforts and campaigns. San Rafael is known for collaborating and it’s our collective imagination and cooperative efforts that make San Rafael such a successful and wonderful place to be. If you’ve ever been to a San Rafael City Council meeting or Climate Change Action Plan quarterly forum you will know this first-hand.
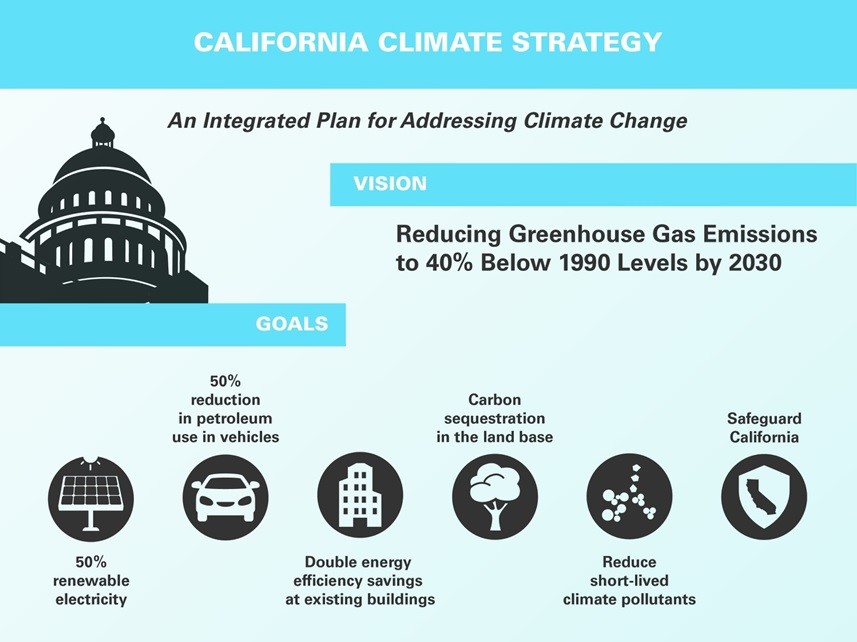
The State of California established the Six Pillars framework in 2015 when Governor Jerry Brown was inaugurated for his second term as governor. These include (1) reducing today’s petroleum use in cars and trucks by up to 50%; (2) increasing from one-third to 50% our electricity derived from renewable sources; (3) doubling the energy efficiency savings achieved at existing buildings and making heating fuels cleaner; (4) reducing the release of methane, black carbon, and other short-lived climate pollutants; (5) managing farm and rangelands, forests and wetlands so they can store carbon; and (6) periodically updating the state’s climate adaptation strategy: Safeguarding California. The measures contained in this Climate Change Action Plan are designed to support and implement the Six Pillars and the goals of California’s 2017 Climate Change Scoping Plan on a local level.
The County of Marin, noting the need for all residents and businesses to actively reduce emissions and plan for climate adaptation has created an engagement framework based on the research and book by local author, entrepreneur, and environmentalist Paul Hawken called DRAWDOWN: Marin. DRAWDOWN: Marin is a comprehensive, science-based, community-wide campaign to do our part to slow the impacts of climate change. It is an effort to recognize our need to reduce our “carbon footprint” and to provide a road map to doing so. Like the State’s Six Pillars, there are six areas of focus: (1) 100% Renewable Energy, (2) Low-Carbon Transportation, (3) Energy Efficiency in Buildings and Infrastructure, (4) Local Food and Food Waste, (5) Carbon Sequestration, and (6) Climate Resilient Communities.
Actions to Reduce Greenhouse Gas Emissions
The Climate Change Action Plan includes a variety of regulatory, incentive-based and voluntary strategies that are expected to reduce emissions from both existing and new development in San Rafael. Several of the strategies build on existing programs while others provide new opportunities to address climate change. State actions will have a substantial impact on future emissions. Local strategies will supplement these State actions and achieve additional GHG emissions reductions. Successful implementation will rely on the combined participation of City staff along with San Rafael residents, businesses and community leaders.
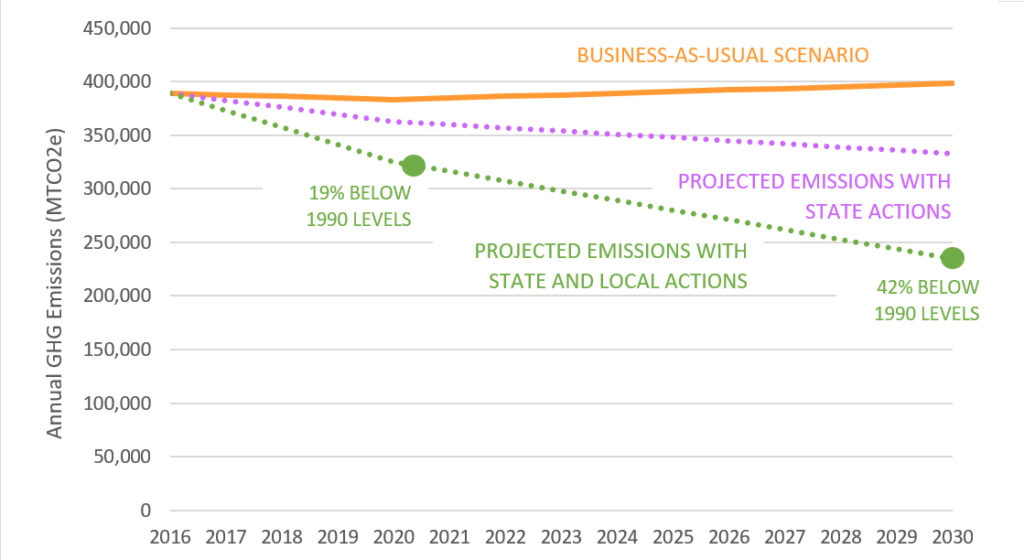
The following sections identify the State and local strategies included in the Climate Change Action Plan to reduce emissions in community and government operations. Emissions reductions are estimated for each strategy; combined, they show that the City could reduce emissions 19% below 1990 levels by 2020 (equivalent to 31% below 2005 levels), and 42% below 1990 levels by 2030, which is enough to surpass the City and State goals for those years. Community emissions are projected to be 233,920 MTCO2e in 2030 with all State and local actions implemented, while the reduction target is 241,455 MTCO2e.[1] As shown in Figure 4, State actions represent about 40% of the reduction expected through implementation of the Climate Change Action Plan while local actions represent about 60%.
Summary of State Actions
The Climate Change Action Plan incorporates State reduction strategies that have been approved, programmed and/or adopted and will reduce local community emissions from 2016 levels. These programs require no local actions. As such, the State actions are first quantified and deducted from projected community emissions in order to provide a better picture of what still needs to be reduced at the local level to get to the overall reduction targets. State actions and emissions reductions are shown in Table 1 and detailed in the appendix.
Table 1: Emissions Reductions from State Actions
| State Action | Emissions Reductions by 2030
(MTO2e) |
|
| Light and Heavy-Duty Vehicle Regulations | 56,880 | |
| Renewable Portfolio Standard | 4,540 | |
| Title 24 Energy Efficiency Standards | 2,870 | |
| Lighting Efficiency | 980 | |
| Residential Solar Water Heaters | 30 | |
| Total | 65,300 |
Note: Numbers may not total due to rounding.
Summary of Local Strategies
The local mitigation measures presented in the following sections, and as summarized in Table 2 below, achieve greenhouse gas emissions reductions in the community of approximately 37,800 MTCO2e in 2020 and 98,085 MTCO2e in 2030.
Table 2: LOCAL EMISSIONS Reduction STRATEGIES
| Strategy |
|
GHG Reductions by 2030
(MTCO2e) |
Percent of Reductions | |
| Low Carbon Transportation | 37,030 | 38% | ||
| Energy Efficiency | 18,280 | 19% | ||
| Renewable Energy | 31,925 | 32% | ||
| Waste Reduction | 10,025 | 10% | ||
| Water Conservation | 830 | 1% | ||
| Sequestration and Adaptation | n/a | n/a | ||
| Community Engagement | n/a | n/a | ||
| Implementation and Monitoring | n/a | n/a | ||
| Total | 98,085 | 100% | ||
These local strategies will be detailed in the following sections. Together, the projected reductions from State and local actions total 163,385 MTCO2e by 2030. Community emissions are projected to be 234,850 MTCO2e in 2030 with the full implementation of the CCAP. This is 42% below 1990 levels and exceeds the reduction target set by the State.
[1] Some of the local measures included in the plan – specifically, LCT-C10, EE-C2, EE-C3, EE-C4 and WR-C5 – are actions that may be taken after additional study and analysis is undertaken. Estimated GHG reductions from these measures total 5,090 MTCO2e. Excluding these measures results in community emissions of 239,941 MTCO2e in 2030, which is still lower than the reduction target of 241,455 MTCO2e.
Local Actions | San Rafael’s Emissions at a Glance | State and Regional Goals | Background