Where We Are At: Emissions Trend and Status
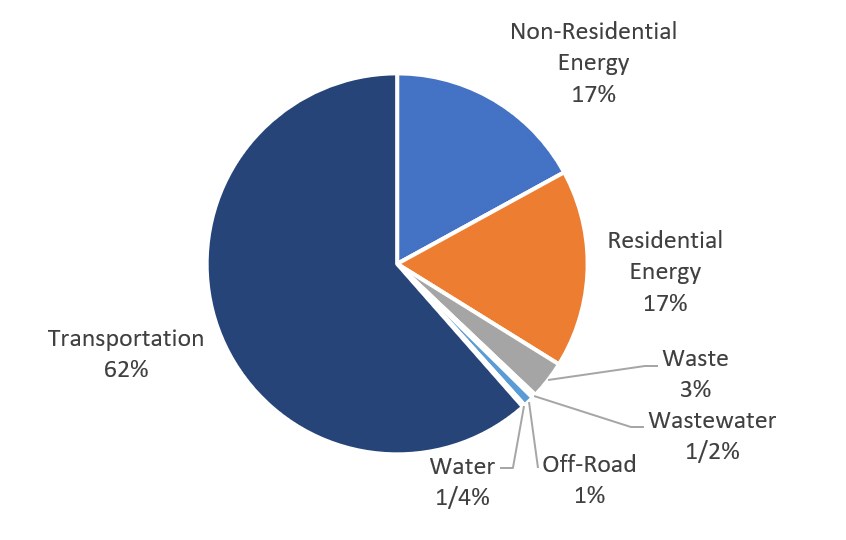
The City prepares an annual community-wide greenhouse gas inventory to track emissions in seven sectors: residential energy, commercial energy, transportation, off-road vehicles and equipment, waste, water and wastewater. As shown in Figure 1, the majority of emissions come from vehicle trips generated by San Rafael residents and businesses. Community emissions totaled 473,440 metric tons of carbon dioxide equivalents (MTCO2e) in 2005, the State’s baseline year. By 2016, emissions had dropped to 389,035 MTCO2e, an 18% reduction. This is well below the State target for San Rafael, which is 15% below baseline (2005) emissions by 2020, and the trendline shows that emissions are on track to meet the City’s local reduction target of 25% below 2005 levels by 2020. While emissions declined in almost all sectors, the largest reductions were due to energy conservation and efficiency, a reduction in the carbon intensity of electricity, and improvements to vehicle fuel efficiency. Emissions from City operations, which make up less than 1% of community-wide emissions, fell 16% by 2016. For more details, see the City’s latest Greenhouse Gas Emissions Inventory.
Emissions Forecast and Reduction Targets
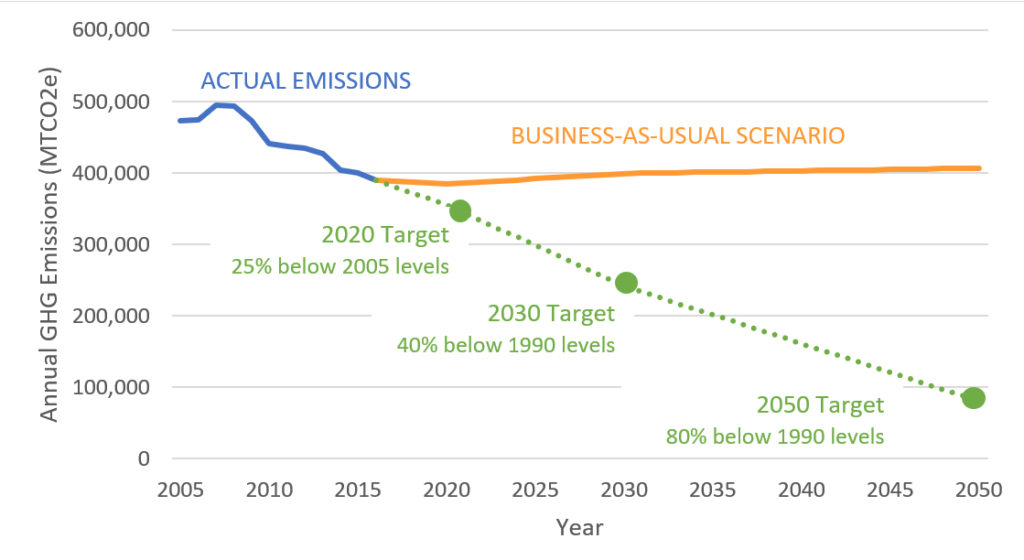
The Climate Change Action Plan includes a “business-as-usual” (BAU) forecast in which emissions are projected in the absence of any policies or actions that would occur beyond the base year to reduce emissions. The forecasts are derived by “growing” (increasing) 2016 emissions using forecasted changes in population, number of households, and jobs according to projections developed by the Association of Bay Area Governments. Transportation emissions are projected utilizing data provided by the Metropolitan Transportation Commission, which incorporate the vehicle miles traveled (VMT) reductions expected from the implementation of Plan Bay Area 2020 and the Regional Transportation Plan adopted in 2017. Emissions are expected to rise about 2.4% by 2030 and 3.3% by 2040. Although the regional agencies have not made official projections for 2050, continuing the trendline suggests emissions would reach approximately 405,530 MTCO2e by 2050 under the BAU forecast.
The Climate Change Action Plan establishes targets similar to the State’s goals to reduce emissions to 40% below 1990 levels by 2030 and 80% below 1990 levels by 2050. In San Rafael, that means emissions would need to drop to 241,455 MTCO2e by 2030 and 80,485 MTCO2e by 2050. The Plan lays out measures that will exceed the 2030 target and put the City on a trajectory to meet the 2050 goal. The community emissions trend, forecast and targets are shown in Figure 2 below.
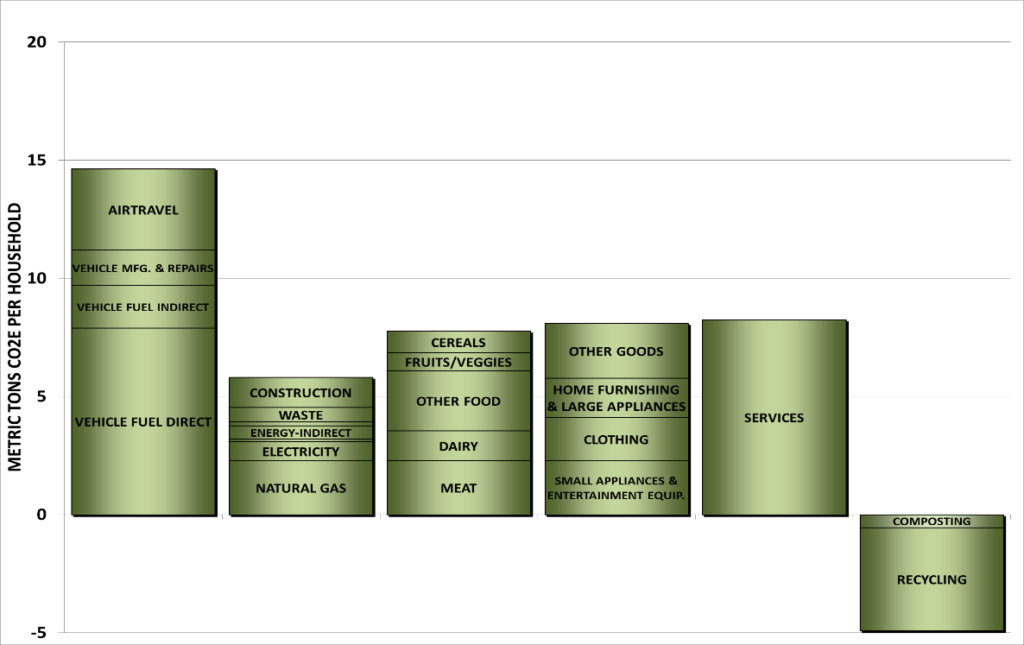
Our Carbon Footprint
The Bay Area Air Quality Management District (BAAQMD) and U.C. Berkeley developed a Consumption-Based Inventory to better understand how our purchasing habits contribute to global climate change. A consumption-based inventory includes emission sources that don’t get counted in the typical “in-boundary” GHG inventory, as well as other items that are difficult to quantify like airplane travel and upstream emissions from the production, transport and distribution of food and household goods. Figure 3 shows the results of the consumption-based inventory for San Rafael households. According to this inventory, the average San Rafael household generates 44 MTCO2e per year. As a comparison, the City’s community-wide emissions of 389,035 MTCO2e works out to about 17 MTCO2e per household. In essence, our consumption drives climate change more than anything and although San Rafael is meeting its state targets for strict “in-boundary” emissions reductions, we as a community have a long way to go. For more information on this and to see carbon footprints by census tract, visit the SF Bay Area Carbon Footprint Map. To learn how to measure and reduce your household carbon footprint, check out our local Resilient Neighborhoods program.